
.png)
Effectively showcasing volunteer impact in annual reports has become increasingly important for nonprofits seeking to strengthen funder relationships and demonstrate mission-driven results. Organizations are turning to more creative, data-driven, and visually engaging methods to highlight how volunteer contributions fuel their work. With tools like Civic Champs for precise volunteer data collection and Storyraise for interactive, multimedia reporting, nonprofits can present volunteer impact in ways that stand out to funders.
Why Volunteer Impact Deserves the Spotlight
Volunteers are ambassadors, donors, advocates, and culture-builders. In many nonprofits, volunteer hours represent hundreds of thousands of dollars in contributed labor, yet annual reports often reduce this enormous value to a single number buried in a PDF.
Showcasing volunteer impact isn’t just about recognition. Funders increasingly want evidence of community engagement, operational efficiency, and mission alignment. Volunteer participation is a powerful proxy for all three. When your report clearly demonstrates how volunteers advance your mission, it signals:
- Strong grassroots support
- Efficient use of resources
- High organizational credibility and reputation
- Ability to scale impact sustainably
In short: When volunteers show up, funders notice.
Use Data Visualization to Make Impact Instantly Understandable
Data visualization transforms raw information into digestible insights. Instead of dense paragraphs or static tables, well-designed visual elements make volunteer metrics easier to interpret at a glance.
Approaches that work well:
- Animated number counters to highlight total volunteers, hours served, or year-over-year growth
- Interactive charts that allow stakeholders to explore data across programs or time periods
- Infographics that connect volunteer activity to outcomes, such as meals served, habitats restored, or students supported
These visuals help signal credibility and make key accomplishments more memorable for funders and board members.
Transform Narratives Into Immersive Storytelling
Narratives give depth and emotion to otherwise abstract metrics. Stories about volunteers, beneficiaries, or program teams help demonstrate the human significance behind the data.
Effective storytelling formats include:
- Mini case studies that illustrate individual or community transformation
- Photo-rich narratives following volunteers through a typical service shift
- Embedded video stories featuring volunteers or program participants sharing their experiences
When thoughtfully packaged, these stories reveal how volunteer efforts translate into real-world impact beyond numbers alone.
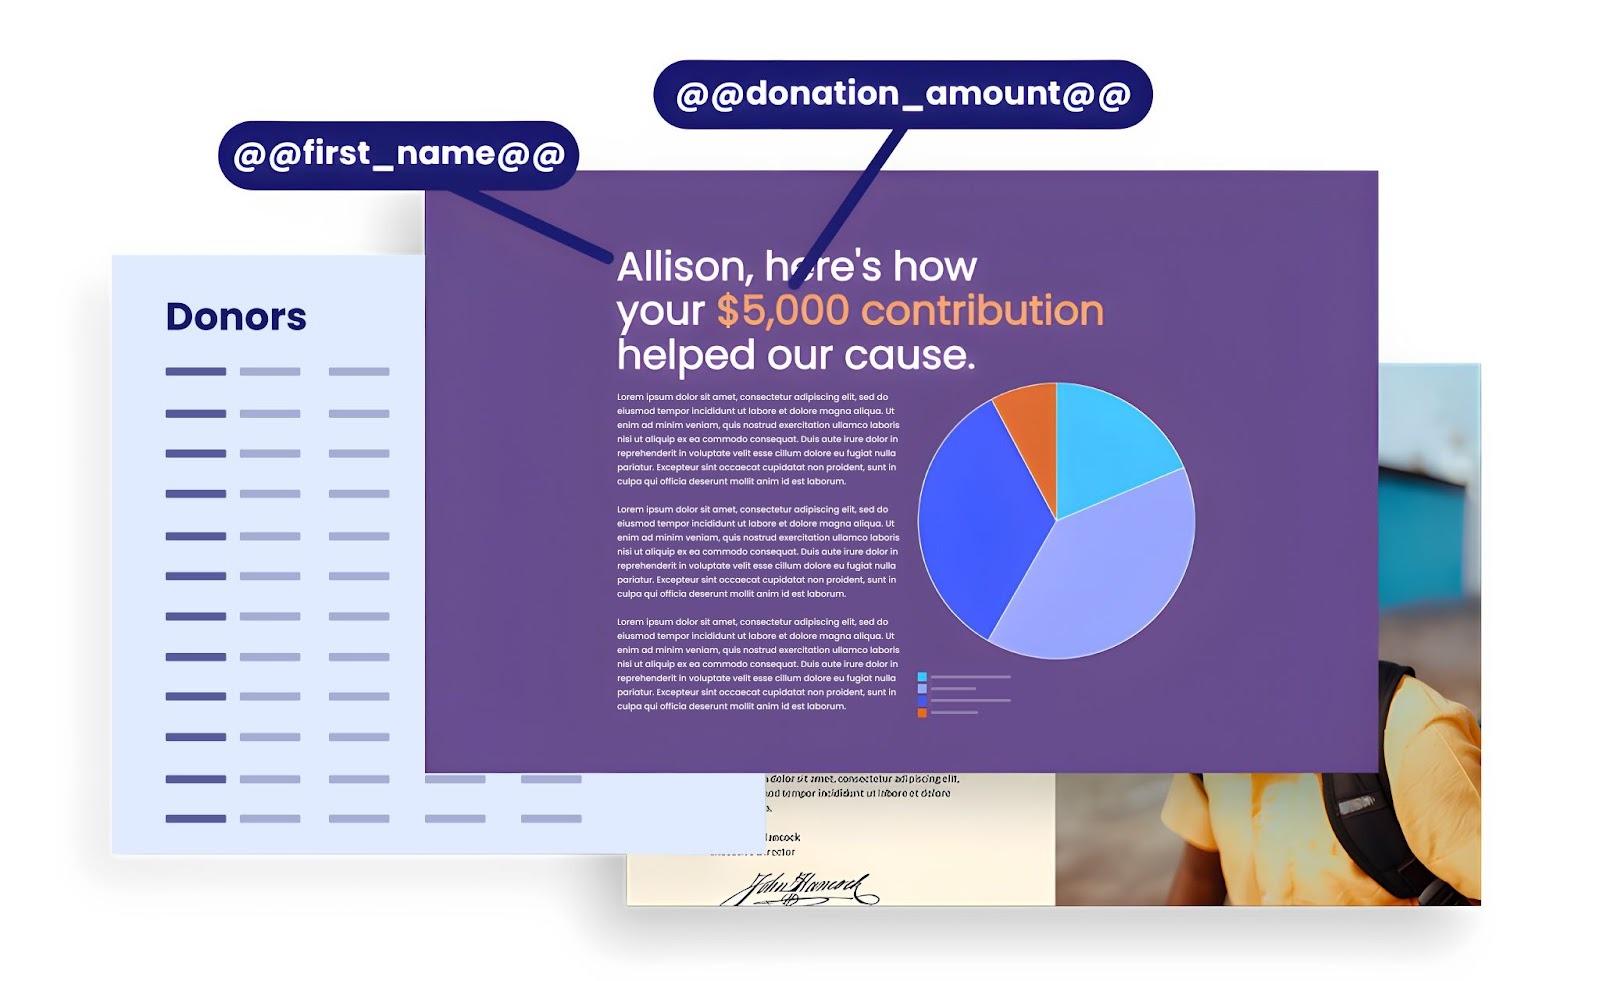
Personalize Report Content for Different Stakeholder Groups
Annual reports often serve multiple audiences — funders, volunteers, board members, and partners — each seeking different insights. Personalized content ensures that every audience segment encounters information that aligns with its interests.
Potential personalization strategies:
- Multiple sections within the same report that are conditionalized to appear only for the audience they appeal to
- Customized data views that highlight financial stewardship for grantors and impact stories for volunteers
- Tailored summaries emphasizing outcomes, operational efficiency, or community engagement, depending on the reader’s role
This approach increases relevance and ensures the report speaks directly to the varying priorities of its stakeholders.
Provide Context to Make Volunteer Metrics More Meaningful
Statistics gain persuasive power when supported by context. Instead of reporting volunteer hours alone, connect those hours to measurable improvements in program reach, cost savings, or operational capacity.
Ways to add context include:
- Converting volunteer hours into an estimated dollar value of contributed labor
- Showing how volunteer efforts enabled additional programming or expanded service areas
- Linking activities to outcomes, such as increased graduation rates, environmental improvements, or reduced food insecurity
Context signals strategic thinking and communicates the true value of volunteer involvement.
Highlight the Diversity of Volunteer Roles and Experiences
Volunteers contribute in a wide range of ways, from hands-on service to professional skill-sharing, to serving on the board. Showcasing this diversity helps demonstrate the depth of community involvement and the sophistication of volunteer management practices.
Content that illustrates diversity:
- Visual breakdowns of volunteer demographics, skills, or commitment levels
- Spotlights on corporate volunteer groups, service clubs, or youth-engagement programs
- Summaries of training sessions, certifications, or volunteer leadership pathways
Diversity-focused reporting helps funders understand the breadth of community participation supporting the organization.
Emphasize Outcomes Rather Than Activities
Outcome-based reporting aligns with funders’ desire for evidence of measurable change. It shifts the focus from what volunteers did to what changed because of what they did.
Examples of outcome framing:
- Activity: “150 volunteers planted trees in the city park.”
- Outcome: “150 volunteers restored 12 acres of green space, improving air quality and expanding recreational access for 1,300 residents.”
Outcomes demonstrate mission alignment and deliver the type of impact evidence funders increasingly expect.
Include Validation From External Voices
External perspectives reinforce credibility and help validate the significance of volunteer contributions.
These may include:
- Short testimonials from community partners or program beneficiaries
- Reflections from long-term volunteers
- Comments from funders about why they support the program
Social proof helps strengthen trust and showcases the broader community ecosystem behind the organization’s work.
Tools to Support These Reports
Nonprofits can significantly enhance their reporting by leveraging platforms that collect, organize, and present volunteer impact data with clarity and sophistication.
Civic Champs
Civic Champs provides streamlined volunteer management and tracking, helping organizations:
- Onboard volunteers with digital waivers and questionnaires
- Easily schedule volunteers with self sign-up options
- Capture accurate volunteer hours
- Track participation through simple digital check-ins
- Collect surveys and engagement data throughout the year
- Export clean datasets for annual reporting
Reliable data from Civic Champs ensures that end-of-year impact summaries are comprehensive and accurate.
Storyraise
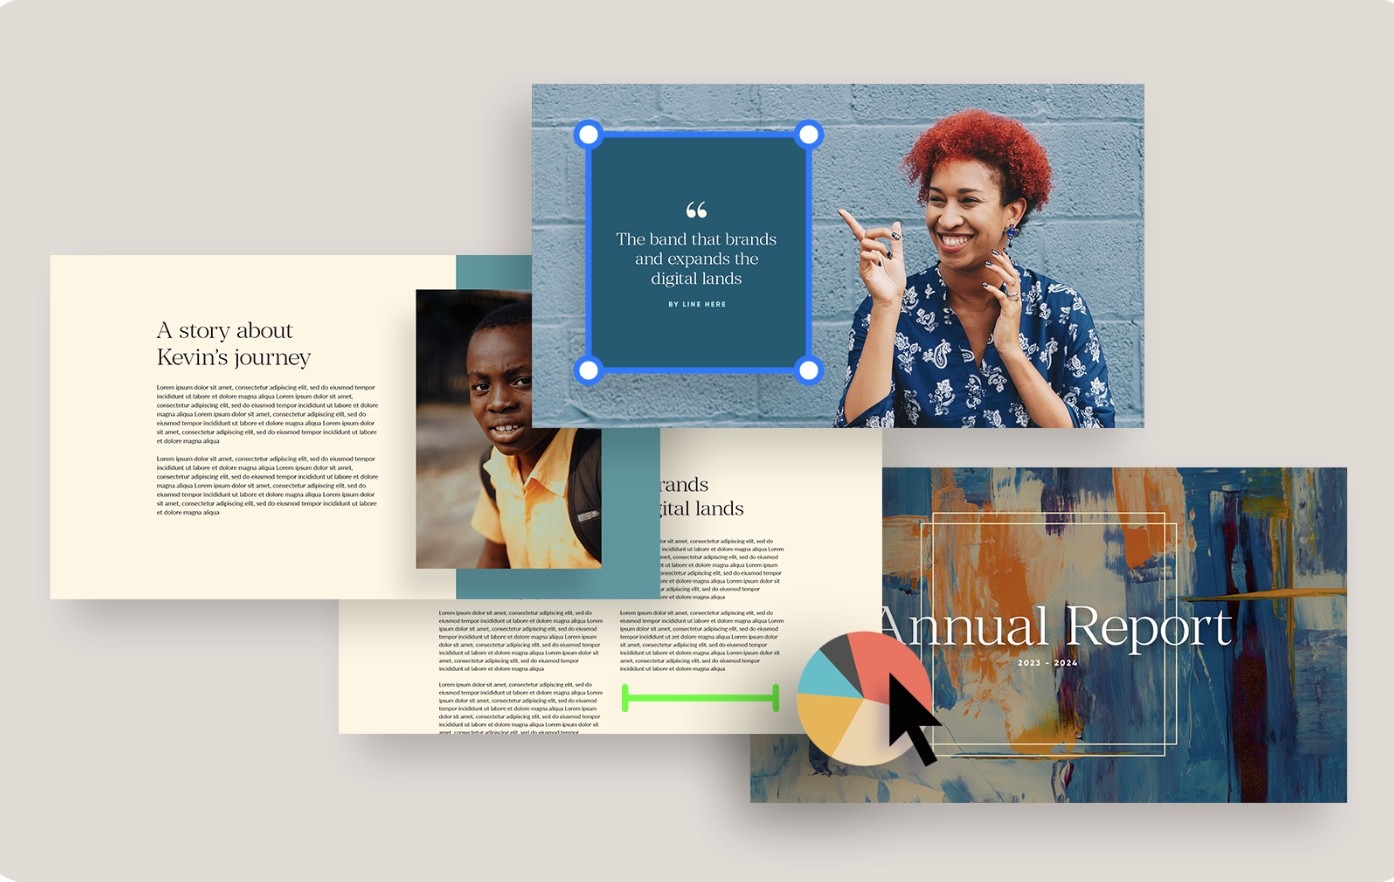
Storyraise enables nonprofits to create interactive, multimedia-driven digital impact reports featuring:
- Personalization at scale, including conditionalized sections so one report can be sent to various audiences
- Animated statistics and number counters
- Interactive graphs
- Embedded videos
- Photo galleries
- Rich media storytelling tools
These features help transform traditional annual reports into immersive digital experiences that engage funders.
Final Thoughts
When used together, Civic Champs and Storyraise create a powerful, end-to-end reporting ecosystem. Civic Champs ensures you have accurate, comprehensive volunteer data and rich engagement insights, while Storyraise transforms that data into dynamic, visually compelling digital reports tailored to different audiences. The result is a seamless workflow — clean data in, impactful storytelling out — that helps nonprofits clearly communicate their value, deepen funder confidence, and celebrate the volunteers who make their mission possible.
Related Questions
- What are the best ways to highlight volunteer impact in an annual report?
Focus on results, not just activities. Pair key metrics (hours served, people impacted, financial value) with concise stories, photos, and quotes. Use simple charts and real examples to show how volunteer actions advanced your mission.
- Why is volunteer data important for funders and grant applications?
Funders want evidence of community engagement and operational capacity. Strong volunteer data demonstrates scale, efficiency, cost savings, and measurable outcomes. This helps funders see their potential return on investment.
- Which digital tools help nonprofits create interactive annual reports?
Tools like Storyraise allow nonprofits to build engaging, web-based reports with visuals, animations, and embedded charts. These tools make impact easier to understand and share.
- How can organizations visualize volunteer hours and contributions?
Use bar charts, infographics, progress circles, heat maps, or before-and-after visuals to translate activity into clear impact. Visualizing trends such as hours over time or value by program can create a more compelling narrative than numbers alone.
- What metrics should nonprofits include in volunteer impact reports?
Common metrics include total hours served, number of volunteers, volunteer retention, impact by program area, financial value of hours, outcomes achieved, and stories that demonstrate qualitative impact. Choose metrics that tie directly to organizational goals.
- How do storytelling techniques improve nonprofit reporting?
Stories humanize data. When nonprofits pair metrics with testimonies from real volunteers, beneficiaries, or transformed communities, readers emotionally connect with the work, making the report more memorable, persuasive, and funder-friendly.
Marketing Manager at Storyraise, dionna@storyraise.com
.png)
.png)
